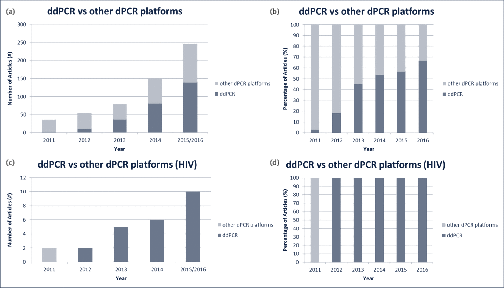
Figure 1. Reported use of different digital PCR platforms over time in published articles from November 2011 until March 2016. The absolute numbers (a, c) and ratios in percentage (b, d) are depicted for ddPCR vs non-ddPCR usage in a general dPCR context
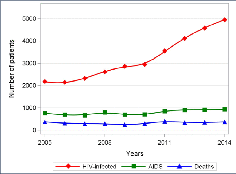
Figure 1. Total number of newly diagnosed HIV/AIDS cases and number of deaths per calendar year in the period 2005–2014 in the WHO region of Central Europe in the period 2005–2014 (ECDC data)
Figure 1. Association between quantity of CMV found in the urine and the severity of disease in neonates. Redrawn from Stagno et al. J Infect Dis 1975; 132: 568–577
Figure 2. Detection of CMV DNA by real time PCR post-transplant is distinct among four subgroups of patients defined by their donor and recipient serostatus pre-transplant. Redrawn from Atabani et al. [14]